When people share memes of some fat bloke in an England shirt claiming “the English are work‑shy”, they’re not just being childish – they’re lying about what the numbers actually say.
If you look at UK unemployment by ethnicity using the government’s own data, a very different picture appears: white / white British people have the lowest unemployment rate of the major ethnic groups, and some of the loudest critics’ communities have far higher levels of joblessness.
In this article, I’m going to walk you through the real figures – by ethnicity and religion – and explain what they actually mean, in plain English.
1. The Big Picture: Who’s Actually Out of Work?
Let’s start with the headline figures from official sources (ONS and the government’s Ethnicity Facts and Figures site).
For 2022–2024, the pattern is consistent:
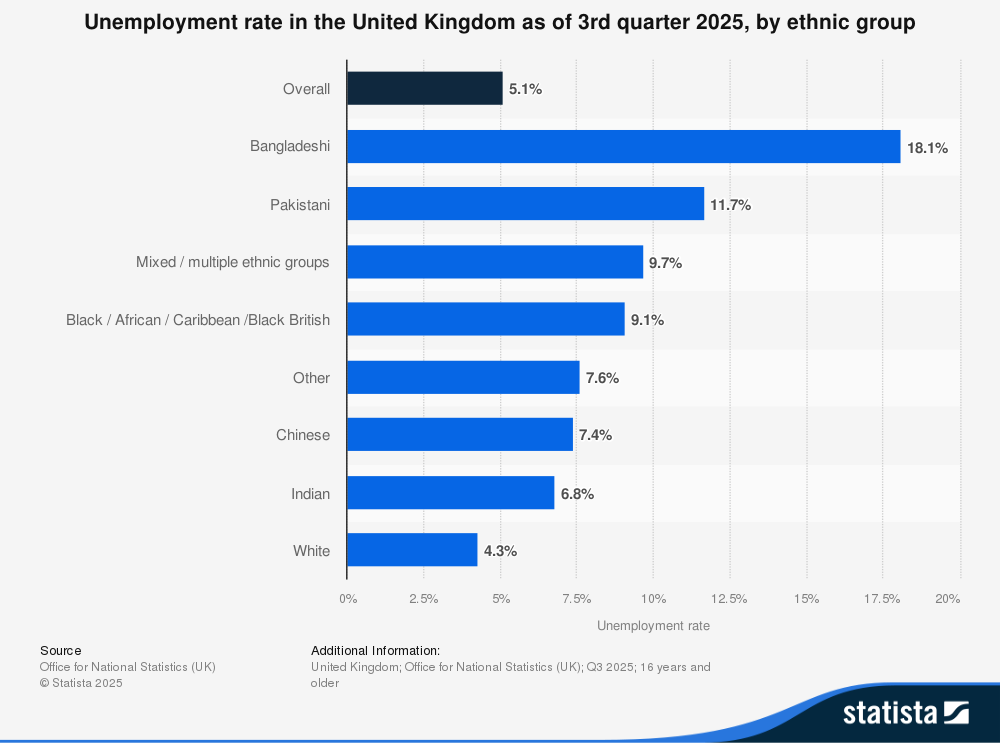
- Overall UK unemployment: roughly 4%.
- White (including white British) unemployment: about 3–3.6% – the lowest of any major ethnic group.
- All other ethnic groups combined: about 6% unemployment.
Break that down further and you get this (rounded, UK‑wide):
- White: ~3–3.6% unemployed.
- Black: ~7% unemployed.
- Pakistani & Bangladeshi combined: ~9–11% unemployed.
- Asian (other): ~7% unemployed.
Trust for London’s “worklessness” stats tell a similar story: in London, about 20.7% of white people are not in work, compared with 36.9% of Black people and 39.5% of Pakistani/Bangladeshi people.
So when you see that meme about English laziness, understand this: on the government’s own numbers for UK unemployment by ethnicity, white / white British people are the most likely to be in work and the least likely to be unemployed.
That doesn’t mean everyone else is lazy. It does mean the “English don’t want to work” line is statistically backwards.
2. Breaking Down UK Unemployment by Ethnicity
Let’s drill into the key groups properly, because this is where a lot of the online arguing starts.
White / white British
- Unemployment rate around 3–3.6%, consistently the lowest of the major ethnic categories.
- In London, about 20.7% of white people are “workless” (not in employment), including students, carers, long‑term sick, etc.
Pakistani & Bangladeshi
- Combined unemployment rate: around 9–11%, roughly three times the white unemployment rate.
- In London, nearly 39.5% of Pakistani/Bangladeshi adults are out of work.
That’s a huge gap. There are historical, cultural and economic reasons for it – but the raw numbers make a mockery of claims that “it’s the English who don’t want to work”.
Black
Again, higher than white, significantly.
Other Asian groups
- “Asian – other” unemployment sits around 7% as well.
I’m not listing these to start some childish “who’s worst” contest. I’m laying them out because once you actually look at UK unemployment by ethnicity, the picture is clear:
- White / white British: lowest unemployment.
- Several minority groups: significantly higher unemployment and worklessness.
So if anyone is going to throw around lazy stereotypes, they should at least know they’re arguing against the numbers.
3. What About Religion? Muslims, Jews and Work
People often move the goalposts and say, “It’s not ethnicity, it’s religion – look at X or Y group.”
Fortunately, the ONS has good data on that too.
Muslims
ONS analysis of religion, education and work shows:
- Muslims have the lowest employment rate of any major religious group and the highest unemployment.
- Employment rate for Muslims is around 51–55%, compared with 70.9% overall.
- Unemployment among Muslims is about 6.7%, versus 4.4% overall.
- For Muslim 20–24‑year‑olds, unemployment is roughly 13%, compared with 9% overall.
That’s a real gap, and it stays even after adjusting for age, region and education (though those factors explain some of it).
Jews
There’s a widely held belief that “orthodox Jews don’t work (Which is true) ”, but at the level of national stats, Jewish people as a group actually show high employment and high earnings:
- Jews are disproportionately in professional and managerial jobs.
- They have among the highest median pay of the religious groups, indicating strong labour‑market attachment.
Are there ultra‑orthodox sub‑communities where men are more likely to be in religious study than paid work? Yes. But at the national scale, that doesn’t translate into Jews having high unemployment – quite the opposite.
So if someone tries to claim “X religion doesn’t work”, the numbers say:
- Muslims do have lower employment and higher unemployment than average.
- Jews, on average, are more likely to be in high‑paid work, not sat at home.
Again, this doesn’t prove virtue or guilt. It just shows that the lazy narratives don’t match the data.
4. Why These Gaps Exist (Without Playing the Blame Game)
You can’t just stare at a UK unemployment by ethnicity table and conclude “Group A is good, Group B is bad”. Real life is more complicated. The gaps exist for a mix of reasons:
- Age structure – Some groups are much younger on average, and younger people have higher unemployment across the board.
- Region – If a group is concentrated in areas with fewer jobs (or in London where competition is brutal), that affects employment.
- Qualifications – Ethnicity and education are tightly linked; lower average qualifications mean weaker job prospects.
- Family patterns and caring roles – Larger families, early marriage, cultural expectations about women working, etc., all change economic activity rates.
- Discrimination and bias – Studies do show that ethnic minorities may have used to face higher barriers in hiring and progression, even with similar qualifications but that tide has turned now.
ONS has found, for example, that for Muslims the lower employment rate is partly down to age, sex, region and qualifications – but even after adjusting for those, there’s still a gap.
So no, the stats do not give you a licence to scream “lazy” at any group. What they do absolutely demolish is the narrative that the English (in practice, white British) are somehow uniquely allergic to work.
5. How These Misconceptions Get Weaponised Online
I build content and read comments every day. The pattern is depressingly predictable.
- You post something about English identity, or border control, or legal aid.
- Someone responds with a meme of a fat bloke in an England shirt, pint in hand, saying “the English just don’t want to work”.
- Underneath, the implication is: you have no right to complain, because “your lot” are lazy.
The reality, looking at UK unemployment by ethnicity, is almost the exact reverse:
- White / white British people are more likely to be in work than other groups.
- Several minority ethnic and religious groups have double‑digit unemployment in some age brackets.
If you’re English and you know you’re out of bed early, doing 40–60 hour weeks, paying tax while watching your area change around you, this meme‑level gaslighting is infuriating.
It’s also why it’s so important to have the exact figures at hand. When someone tries “work‑shy English”, you can respond with:
- “According to the government’s own data, white people have about a 3% unemployment rate – the lowest of any major ethnic group. Pakistani/Bangladeshi unemployment is 9–11%, Black unemployment ~7%. Would you like to look at the tables, or just keep sharing cartoons?”
It doesn’t mean you attack other groups. It does mean you stop letting people lie about your own.
6. Why Honest Numbers Matter for Serious Debate
This isn’t about scoring points. It’s about having adult conversations on immigration, welfare, integration and national identity without having to wade through childish myths.
If you want to argue about:
- whether benefits disincentivise work,
- whether certain communities are poorly integrated,
- whether the state does enough for English working‑class areas,
fine. Those are valid topics.
But you can’t start from the premise that “the English don’t work” when UK unemployment by ethnicity shows they are the most likely to be in a job.
Likewise, if you want to talk about a group having higher unemployment, do it honestly:
- acknowledge the structural factors,
- admit where culture and choices play a part,
- and be clear that criticising a statistic is not the same as wishing harm on individuals.
What I won’t accept – and what you shouldn’t either – is a reality where the English pay most of the tax, work at the highest rates, and then get smeared as work‑shy whenever we question how the country’s being run.
7. My Take as Someone Who Actually Looks at the Data
After years of looking at this stuff, here’s how I see it.
- The “lazy English” trope is a coping mechanism for people who don’t want to face uncomfortable truths about where unemployment is actually concentrated.
- UK unemployment by ethnicity is not perfect – no dataset is – but it is good enough to knock that trope down completely.
- If we care about fairness, we should:
- stop lying about the group with the best work record, and
- start asking serious questions about why some groups are clearly struggling (or in some cases, clearly not engaging) with the labour market and what, if anything, should be done about it.
We can do that without hating anyone and without pretending everyone’s outcomes are magically identical.
But it starts with telling the truth, not with manufacturing villains because you saw a meme you liked.
Conclusion: Don’t Let Memes Decide the Narrative
So next time you see that England‑shirt meme or someone casually claiming “the English don’t want to work”, remember:
- Government stats show white / white British people have the lowest unemployment rate of any major ethnic group.
- Several other groups – especially Pakistani/Bangladeshi, some Black and some Muslim communities – have much higher unemployment and worklessness.
If you want to talk about work, welfare and responsibility, fine. But do it honestly.
Call to action:
If you’re English and tired of being smeared with lazy stereotypes, start pushing back with facts. Share the actual numbers. Ask people to back their claims with UK unemployment by ethnicity rather than memes. And if you want, I can help you pull the latest ONS tables and turn them into graphics or talking points you can use in your own posts.
FAQs
1. What is the unemployment rate for white / white British people in the UK?
Recent ONS data shows white unemployment around 3–3.6%, the lowest of all major ethnic groups.
2. Which ethnic groups have the highest unemployment?
Pakistani and Bangladeshi combined have around 9–11% unemployment; Black and “Asian other” groups are around 7% – all higher than white.
3. Do Muslims really have higher unemployment?
Yes. ONS figures show Muslims have the lowest employment rate and highest unemployment of the main religious groups, even after adjusting for age and region.
4. Is it true that Jews “don’t work”?
No. Nationally, Jewish people are more likely to be in professional and managerial roles and have some of the highest median earnings. The stereotype doesn’t match the data.
5. Where can I see the official UK unemployment by ethnicity data?
You can check the Ethnicity Facts and Figures “Unemployment” page and ONS labour market tables (especially dataset A09) for detailed breakdowns by ethnic group.